Data Governance · Data Mapping
Draw how personal data moves through your organisation.
A diagram of sources, applications, processors, storage and destinations, built from the flows your teams record.
The problem
The systems are known. The movement between them is not.
An inventory tells you where data rests. It does not tell you that the CRM sends a nightly export to a marketing platform, or that the support tool is hosted in another country.
- Integrations are set up by individual teams and never drawn.
- Architecture diagrams show infrastructure, not personal data.
- Third parties and overseas hops surface only when something goes wrong.
What it does
Data Mapping in ControlMap
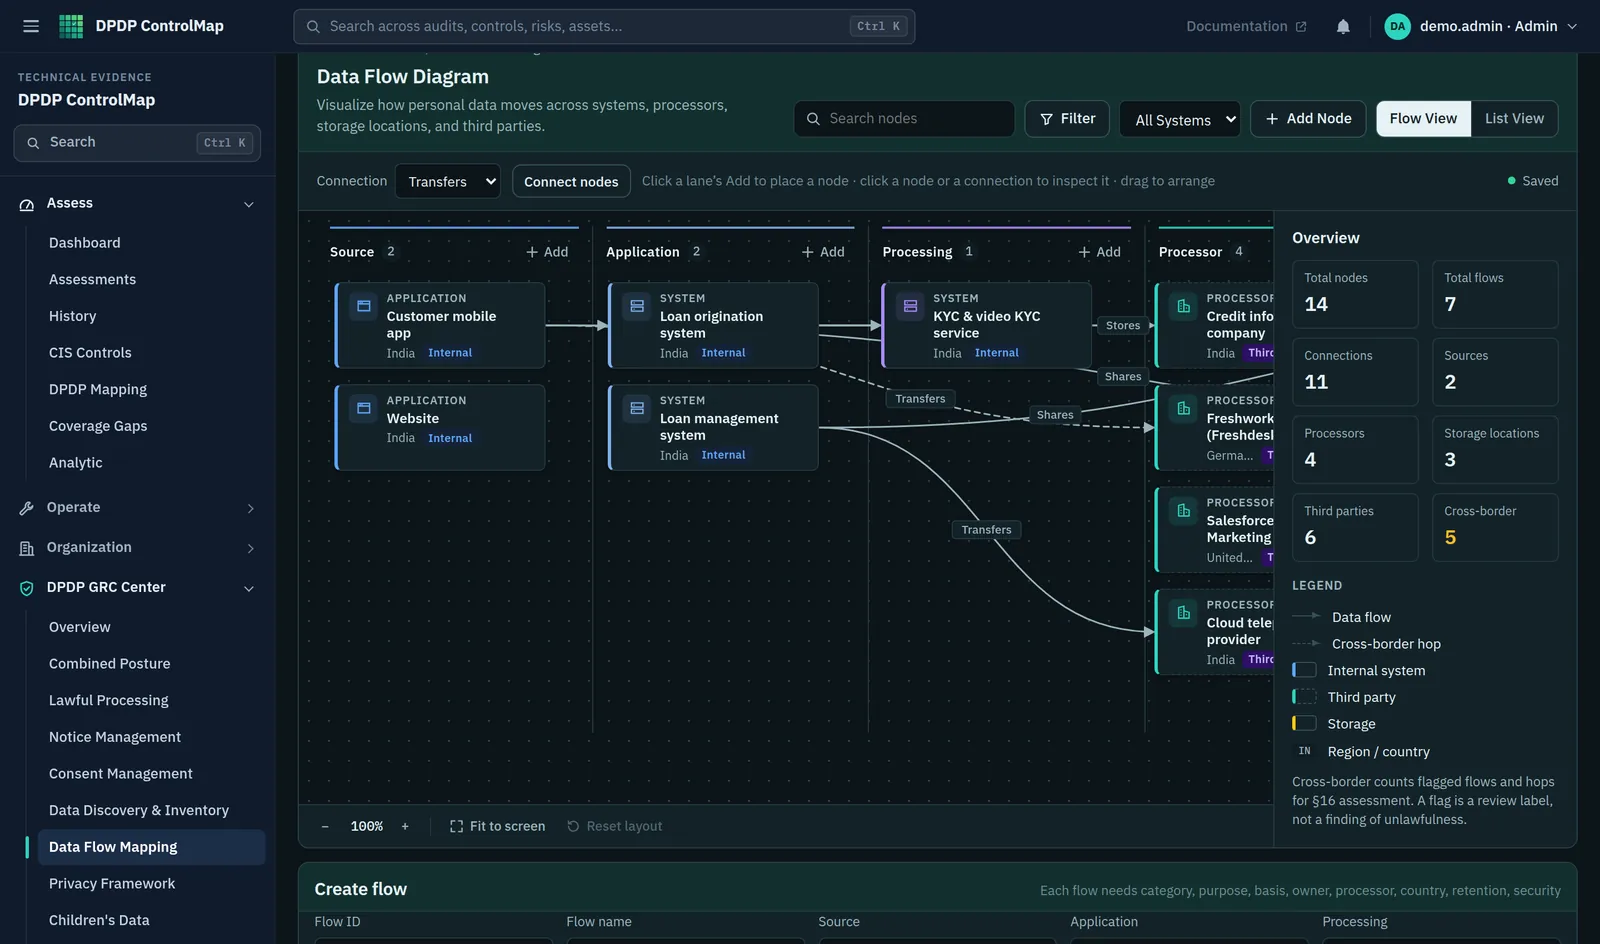
Data Flow Mapping records each movement of personal data as a flow between two points, and draws the result. Systems appear as nodes in lanes for source, application, processing, processor, storage and destination. Each connection is labelled with what it does: transfers, processes, stores, shares or exports.
Beside the diagram, the module counts nodes, flows, processors, third parties and cross-border hops, so the shape of the organisation's processing can be read at a glance.
Key capabilities
What you can do with it
Lane diagram
Six lanes from source to destination, so the direction of travel is clear without a legend.
Typed connections
Each arrow says whether data is transferred, processed, stored, shared or exported.
Processors and third parties
Processor nodes sit in their own lane and are counted separately.
Cross-border hops
Flows whose destination is in another country are identified and counted.
Summary counts
Nodes, flows, processors, third parties and cross-border hops beside the diagram.
One source of truth
The diagram is drawn from the flow register. Changing a flow changes the picture.
In the product
The flow diagram
Systems are arranged in lanes and joined by labelled arrows.
- Lanes for source, application, processing, processor, storage and destination
- Arrow labels for transfers, stores and shares
- A side panel with counts of processors, third parties and cross-border hops
Typical workflow
How teams use it
A common sequence. The product does not force the order, and you can return to the earlier steps as you learn more.
Start from collection
Record where personal data enters: a website form, an app, a branch, a partner feed.
Follow it inward
Add the applications and processing steps it passes through.
Add processors and storage
Record each processor and each place the data comes to rest, with its country.
Record where it leaves
Add shares and exports to other organisations as destinations.
Read the diagram with the owners
Review the picture with the teams who run the systems, and correct it.
DPDP governance
How it supports your obligations
A flow map is not required by the Act. It is how an organisation answers, with confidence, the questions the Act does ask.
A Data Fiduciary is responsible for processing undertaken on its behalf by a Data Processor, and may engage a processor only under a valid contract.
The map shows every processor that receives personal data, which is the list of contracts to check.
A Data Principal may obtain the identities of other Data Fiduciaries and Data Processors with whom personal data has been shared, with a description of the data shared.
Shares and their recipients are recorded as flows.
Transfer of personal data outside India is subject to restrictions the Central Government may notify.
Flows to another country are identified, and feed the cross-border assessment.
Scope
What stays with you
We would rather you knew the boundaries before a demo than discovered them after.
- Flows are recorded by your teams. ControlMap does not observe network traffic or read integration configurations.
- The diagram is as complete as the flow register behind it.
Questions
Data Mapping: common questions
Is the diagram drawn by hand?
No. You record flows in a form, and the diagram is generated from them. There is no canvas to arrange.
How is this different from Data Flow Management?
Data Mapping is the picture. Data Flow Management is the register behind it and the review of each flow for owner, basis, processor and country.
Can it import flows from our integration platform?
Not today. Flows are entered in the product.
See Data Mapping in a demo.
We will show the module with the product's sample data and answer what it does and does not cover.